Microsoft Professional Program – Data Science

Last year, from oktober 2016 up to january 2017, I participated in Microsoft’s Professional Program, specifically the Data Science track.
It was only the 1st public iteration of the program but back then it already felt like a mature course.
This probably had to do with the fact that there had already been a private run of the course in the months before.
David Eldersveld (twitter | blog) was one of the participants in that original run and he gives you a high level overview on his blog.

In this post I’ll be going into a bit more detail and explain how I experienced the program.
In short, there was joy and there were tears.

Read on for the full story!

Read moreMicrosoft Professional Program – Data Science

I’m attending and presenting at… ALL THE EVENTS!

This year I’ve already presented at more events than I dreamt off at the start of the year (5).
And the invites keep coming in! (5 more!)
This is going to be a long read, a punishment from me to me because I slacked off in blogging in the past months.

So apart from being bored, there’s 2 reasons why you would want to read this post.
1) Interest in, but some fear of, attending and presenting at conferences, user group and community events in general.
2) You’re me from the future and you’re wondering about that amazement and the exciting feeling the young Jan had about these first events. You’re wondering about what fears you overcame and you want to look back at how it all started.

Expect to find the following:

  • UK Power BI Summit (2017/02/17)
  • Denver SQL Server User Group (2017/03/17)
  • Battle of the Beards (2017/03/29)
  • SQL Saturday Israel (2017/04/26)
  • Belgian Information Worked User Group (2017/05/09)
  • in short: 5 more events to find me at before the end of june!

So whichever reason you have, come on in and start reading!

Read moreI’m attending and presenting at… ALL THE EVENTS!

Rubbing DevOps on your Database

DLM Lifecycle

I’ve had quite a busy year and one of the things I’ve done was attend a 3 day Database Lifecycle Management (DLM) training.
If you’re into DevOps, Continuous Integration (CI) , Continuous Delivery or Deployment (CD) or you’re just automating as much as possible, then it’s very likely you’ll run into some challenges regarding your databases.

For most people, overcoming these challenges cost a lot of time.
But even before you can spend a lot of time overcoming your challenges, you’ll notice that there are a ton of tools out there that can help you.
So you’ll first have to pick the tools you’re going to use and then you need to learn how to use them.

This brings us back to the training I got to attend thanks to my employer Ordina.
More specifically, they were 3 workshops lead by Alex Yates (blog | twitter) from DLM Consultants (website | twitter).
In total they covered the 3 different main parts of the Database Lifecycle Management process.

  • Database Source Control
  • Database Continuous Integration
  • Database Release Management

Read on for my experience with these full-day online workshops.

Read moreRubbing DevOps on your Database

Back from a break in 2016

What a year!
2016 just flew by and I almost missed it!
Let’s recap what I think are some highlights of the year:

Community

  • SQL Server 2016
    We got a ton of Community Tech Preview (CTP) versions and then launch of the latest SQL Server version
  • Power BI became even more incredible than before
    And everyone is loving it!
  • Azure Data Factory became a lot easier to use
    But it seems to be getting no love yet
  • Azure Machine Learning got some incredible new features
    Opening a lot of possibilities which I’m not seeing covered by anyone yet!
  • I presented my first webinar
    And luckily there’s room for improvement 🙂
  • The SQL Community Slack channel
    Which is a great resource to get in touch with other community members
  • PASS Summit 2016, Ignite 2016 and ML & DS Summit 2016 all came and went. I still haven’t watched everything I wanted to see from these great events.

Personal

  • I made a bazillion draft posts for this blog.
    And I’m going to start completing and posting them.
  • I started writing a book.
    And that’s way harder then I previously imagined.
  • I taught a couple of SQL Server and BI related classes to 2 groups of starters at Ordina, the company I work at.
  • Teaching others helps me get new insights as well.
    Mainly in how I bring some types of content to particular audiences and how I can help others grow.
  • I’ve started participating in a couple of user groups
    Most notably: satRdays and as readers of my blog already know: Virtual Global Power BI User Group
  • I participated in the new SQL Server beta exams
    They were not at all comparable to the ones for SQL 2012/2014. In my opinion they were much harder but also less related to real world things. I’m sure they will change a lot before going live but a blog post about them will follow soon.
  • I’ve started the MPP courses from academy.microsoft.com after a couple of tweets with David Eldersveld (blog | twitter).
    He’s also made a great post about it, go read it.

What’s next?

This blog and everything else community related are things that always keep going forward.
With so much new things appearing, my first instinct is to play around with those things before posting anything about it.
However, I’ve learnt that sharing while you learn is something most people seem to appreciate. People tend to love following the growing process. I can only guess that it helps them measure their own progress.

I’m also sure that a lot more cool stuff will be happening in the community in the coming months and years.
Until then, let’s try together to keep up with all things data related.
So if you have questions or want me to blog about something in particular, please contact me via the comments or on twitter!

This is my second post to catch up on a year of saving drafts, watch out for more.

Presenting a webinar, not the same as a conference

Last saturday Back in January, I presented my first webinar for the Global Power BI usergroup.
It was a redelivery of the Personal BI to Personal Data Science session I’ve already given twice together with my colleague Kimberly Hermans (twitter).
Although there was no real negative feedback and even some positive feedback in private, I don’t think I did great.

I approached the webinar the same way as I do a regular presentation.
And boy oh boy, was I wrong to do it this way…

There’s all kinds of different and extra things to take into account compared to an in-person conference or usergroup presentation.

  • The software you’re using
    We used Google+ Hangouts and while I tried it out before the webinar, I didn’t prepare how I would be taking questions. That could’ve gone a lot better.
  • The microphone you use
    The microphone I used was the one that came with my phone. The quality wasn’t the best, especially combined with the room I was in.
  • The room you’re in
    Using a cheap microphone tends to be OK. But in the wrong room you’ll get a lot of echo or environment noise.
  • No or very limited interaction with your audience
    This one struck me the worst. I couldn’t interact with or read the audience which made me unusually nervous.

On top of that, because of conflicting schedules I had to present alone this time.
I thought I would be OK as I knew most of the data science stuff on a basic level.
But it also means that all the interaction and the dynamic that previously existed in the presentation was gone. No jokes, no natural tempo changes, no interaction between presenters.
In my opinion this was the main killer of the webinar.

What’s next?

UserGroup

The Virtual Global Power BI User Group is still organising monthly webinars. You can join or present yourself as well.
Or just participate in the usergroup via different channels like TwitterFacebook, LinkedIn and our YouTube channel.

Personal

I’m embarking on a new webinar journey as well.
More news will follow soon.


Power BI and R – Part 3 (Getting started)

This entry is part [part not set] of 3 in the series Power BI and R

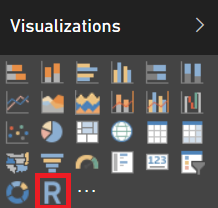
In this post we’ll look at some simple examples of how to use R in Power BI.
While going through these examples, we’ll have a look at what is already possible in this preview version and what is not possible.
We’ll do this by slowly examples from scratch so you can follow or rebuild the examples yourself.
I’ll keep the technical explanations to a minimum as there are already a ton of books and courses filled with that.

So if you’re seeking deep knowledge of the inner workings of R, this post is going to disappoint you.
However, if you’re looking to keep it simple and just get started building cool or useful visualizations in R to explore your data, just keep reading!

In case you missed the previous posts:

In part 1 of this series, I gave you a couple of reasons to start using R for visualizations in Power BI.
In part 2 of this series, I gave you remarks on the R integration. You might’ve caugtht a glimpse of what is possible if you stepped outside of the lines that Microsoft drew. And I showed you an ugly error you can receive because of  decimal symbol setting in your OS.

Read morePower BI and R – Part 3 (Getting started)

Power BI and R – Part 2 (Remarks and errors)

This entry is part [part not set] of 3 in the series Power BI and R

In part 1 of this series, I gave you a couple of reasons to start using R for visualizations in Power BI.

In this part I’ll tell you about the things I discovered and the problems that I ran into in this preview version.

Please note that the remarks below count for the december 2015 version of Power BI Desktop.
R script visuals is still a preview, things might change in later versions.

Read morePower BI and R – Part 2 (Remarks and errors)

Power BI and R – Part 1 (Intro)

This entry is part [part not set] of 3 in the series Power BI and R

First we got Get Data through R Script in beta.
Not much later, we got Custom Visuals through R Script as well.

Everyone was happy…
Twitter went crazy with happiness…
No blogs followed…

“On the fields of Trenzalore, at the integration of R in Power BI, when no living creature can speak ill of R, a Question of how to use it will be asked, a question that must never, ever be answered.”

SilenceWillFall

Read on to learn why R is included in Power BI and if it is something you should even care about. (hint: of course! 😉 )

Read morePower BI and R – Part 1 (Intro)

Global Virtual Power BI User Group

A lot of very cool stuff has been going on lately.
Not only in Microsoft land, but also in my own live and it will affect you as well!
Read on for some great news.

At the end of August, Vishal Pawar (twitter | blog) contacted me via twitter.
He was wondering if I was interested in creating a virtual Power BI community together with him and a couple of other incredible people.
Of course I was interested, but I was already booked completely full for the coming period.
I gave Vishal all my contact info and asked him to please keep me up to date.

Fast forward to November where Microsoft announced Power BI User Groups to support the Power BI community even more.
This announcement made Vishal pick up the previous idea again mid november.
And so the Global & Virtual Power BI User Group (forum | twitter | facebook) came into existence.

Because of previous engagements I wasn’t able to actively participate yet.
This changed last week when I contacted Vishal and was welcomed with open arms.

Very active community

One of the things that amazed me the most was that there’s already an active community!
It doesn’t matter what platform you like the most, the Global Power BI community is active on most of them.

Power BI Community forum
Facebook
 300+ members as of 2015/12/27
LinkedIn 600+ members as of 2015/12/27

Because Vishal asked me, I’ll also list the people who are leading this community.
Check out all these awesome people, in alphabetical order by first name:

Adam Saxton USA (youtube | twitter)
Ásgeir Gunnarsson Iceland (twitter)
Damodaran Venkatesan USA (twitter)
Dustin Ryan USA (blog | twitter)
Gilbert Quevauvilliers Australia (blog | twitter)
Jan Mulkens Belgium (blog | twitter)
Michael Olafusi Nigeria (blog | twitter)
Patrick Guimonet France (blog | twitter)
Praveen Joshi India
Reza Rad New Zealand (blog | twitter)
Vishal Pawar USA (blog | twitter)

Why a Global & Virtual User Group?

Basically this is a User Group for anyone, anywhere and at any time.
There is no need to hurry to a local meetup after working hours or worry about having to excuse yourself again because of your busy personal life.

Log into the forum at midnight local time and ask a question. Or even answer a question someone else had.
View the latest news on the facebook group or share something cool you saw.
Watch a recording of a previous webinar or volunteer to give a webinar.

Whatever your goal is, you’ll be able to achieve it at your own pace together with some very smart people from all over the world.
Just know that the Global Power BI User Group will be there to support you.
And who knows, you’ll probably even make a ton of new friends!


In person meetups

While the Global Power BI User Group might still meet in real life in the future, if you’d like to find a local Power BI User Group near you today, don’t hesitate do so!

Nothing should stop you from joining a local when you’re already a member of the Global Power BI User Group.
Personally I’m also a member of the Belgian Power BI User Group!


Virtual meetups!

There are already more than 300 members in the Global Power BI User Group.
Adam Saxton AKA “Guy In a Cube” (blog | twitter) gave a first presentation, introducing the Global Power BI User Group, a couple of weeks ago.
And now we’re about to announce our second presentation.

It will be a reworked version of “Personal BI to Personal Data Science“, a session demonstrating how Power BI can easily be used by anyone to not only democratize BI but also data science.
I’ve already given this presentation twice in the past month. First time at the “Data Culture Day London – Power BI Edition” and the second time at the local Belgian SQL Server user group.

In addition the the previous content, we’ll dip our toes into the a new feature: using R within Power BI!

So far I’ve given this presentation with my colleague Kimberly Hermans (twitter), a data scientist.
With her experience, she rocks the data science parts in the presentation and she can answer your questions surrounding data science. I expect her to show up but she’s not sure about her agenda yet.

In summary:

  • Webinar: Personal BI to Personal Data Science with Power BI
  • When: January 16th, 2016 at 10:30AM EST (GMT -5)
    (Convert to your local time zone)
  • View: Google Hangouts on Air
    • You can’t pre-register anymore but you can follow live on the day!
    • Or you can watch the video afterwards!

Also, don’t forget to join the Global/Virtual Power BI User Group !


Questions or just some feedback you want to give?
Leave a comment, tweet me or go to the Global Power BI User Group forum or facebook page!


Goodbye Datazen, Hello Mobile Reports

24 hours ago I noticed CTP 3.2 being mentioned on MSDN and the download center.
A couple of hours ago it was released, AND HOW!

As we’re used by now, the SQL Server team has made a huge effort.
Get a jump start on all the new features here:

The real treat, and the subject of this blog post, lies in the integration of Datazen into SQL Server Reporting Services.


Mobile Reports released

I’m going to be very brief on this subject because it’s all still very new and I’m sure you want to get started yourself!

The workflow for mobile reports currently boils down to:

  • Authoring of reports in the SQL Server Mobile Report Publisher
  • Publish to on-premises SSRS
  • Consume in Power BI Mobile app

There’s even a new SSRS web portal which you might recognize if you ever used Datazen!

SQL-Server-Reporting-Services-web-portal[1]

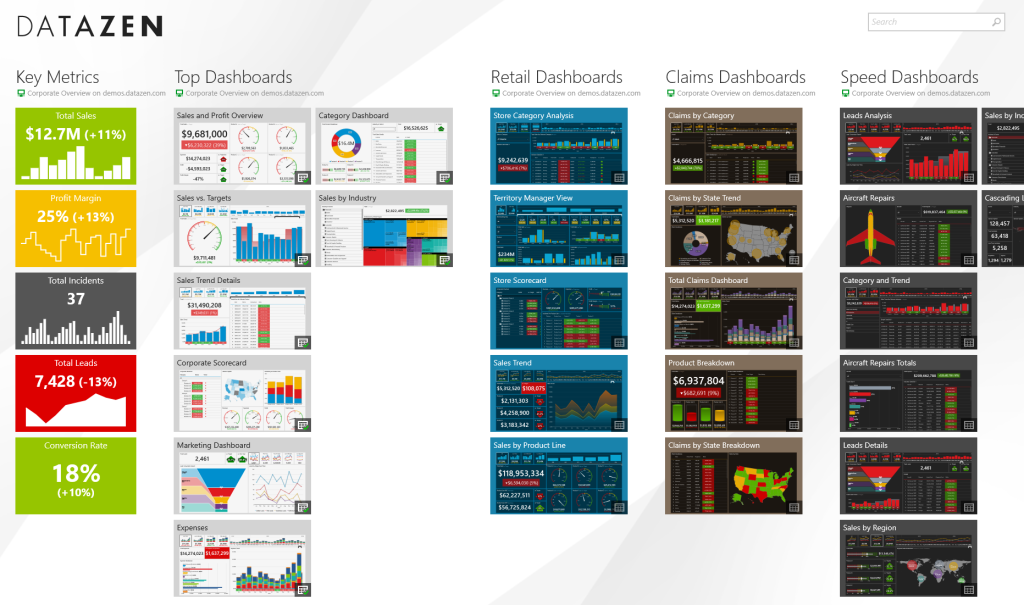
For comparison, here’s the Datazen portal.

Datazen

Do you see what Microsoft did?
Perfect integration of Datazen into Reporting Services!
We even notice the differentiation being made between KPI’s, mobile reports and paginated reports.


Start your own Mobile Reporting!

  1. Get SQL Server CTP 3.2 over at the evaluation center.
  2. And get the CTP 3.2 downloads like Report Builder from the download center.
  3. While those are downloading, read up on

There is some sad news however, the Mobile Report Publisher is not available yet.
It is planned for the end of december.

IC840421[1]

Crucial step: Remember to provide Microsoft with a lot of feedback so they can improve the area’s that you think are not up to par yet.


Completion of the Microsoft BI Roadmap

If you’re wondering what the BI roadmap looks like, quickly check this blog post from almost 2 months ago!

After you’ve looked at the road map, you too will notice that this release is a huge leap for SQL Server. The on-premises BI stack now seems to be feature “complete”.
We already had

  • Spreadsheets (excel)
  • Paginated reports (SSRS)
  • Interactive reports (Power BI Desktop)

And we now also received Mobile Reports integrated in SQL Server!

The best thing probably is that your users can enjoy Mobile Reports and Power BI reports in one and the same app. This ensures that they will have the same experience and makes it a bit easier to manage for IT.


What are your thoughts on this course for Mobile Reporting in SQL Server?
Were you expecting something different from the Datazen integration?
Let me know in the comments or via twitter!


%d bloggers like this: