- Power BI 2.0 – Day 2: Power BI Desktop and our first dashboards
- Power BI 2.0 – Day 1: Introduction
![]()
Power BI: Zero to Hero series
Day 2: Power BI Desktop and our first dashboards
Today we’ll take a look at the new Power BI Desktop application and we’ll create our first (or 3 first) simple dashboard(s).
We’ll be using different data sources like Excel, an OData feed and even a web page!
In this blog series, together we’ll go from beginner to expert in Power BI as fast as humanly possible.
On our path, we’ll use Microsoft and non-Microsoft resources and we’ll try to explore what Power BI can add to an enterprise BI stack.
We’ll be using datasets like the old AdventureWorks database and any useful databases we can get from opendata initiatives.
But we’ll also explore the new data source possibilities included with Power BI.
These include web pages, OData feeds, On-Premise Tabular models and much more.
Read on to get started!
First encounter with Power BI Desktop
Buckle up, today we’ll install the Power BI Desktop application.
Next we’ll connect with our first data sources, Excel and an OData feed.
And lastly we’ll create our first report.
We’ll take Power BI for a free test drive without creating an account or subscribing to a service.
This is made possible by the free Power BI Desktop application, a 57mb download.
Getting Power BI Desktop
Let’s get started by downloading the Power BI Desktop application from www.powerbi.com
Visit the site, scroll down to the end of the page and go to the download page by clicking on the link “Power BI Desktop” as highlighted in below picture.
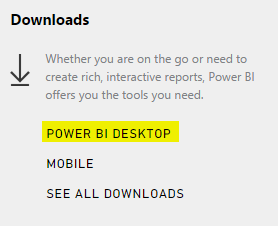
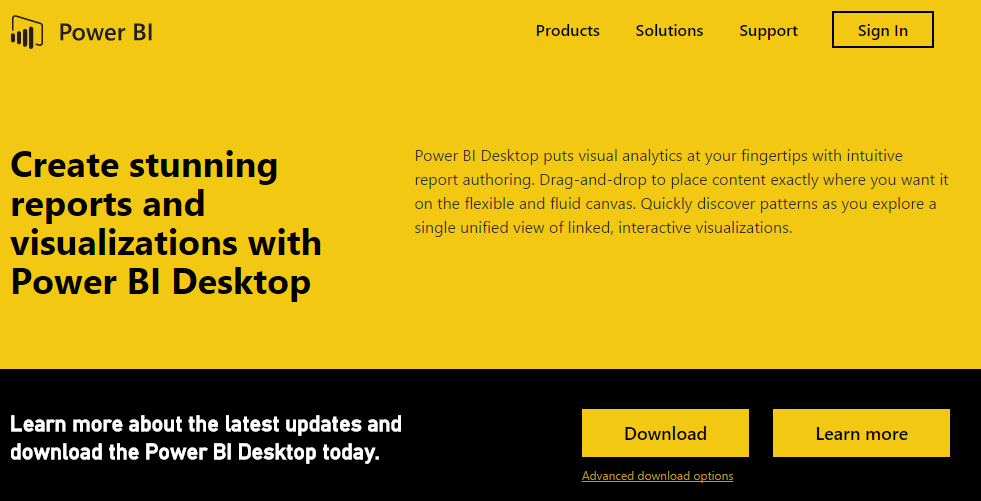
This will take you to the download page where you can now click the download button and start your installation.
Open the Power BI Desktop application after the installation finishes.
Power BI Desktop, first run
The first time we run the Power BI Desktop application we’ll be greeted with the following, very yellow, screen.
Don’t dismiss this screen yet!
It might seem like one of those useless screens you never want to see.
But let me explain to you why this is such a great screen to receive.
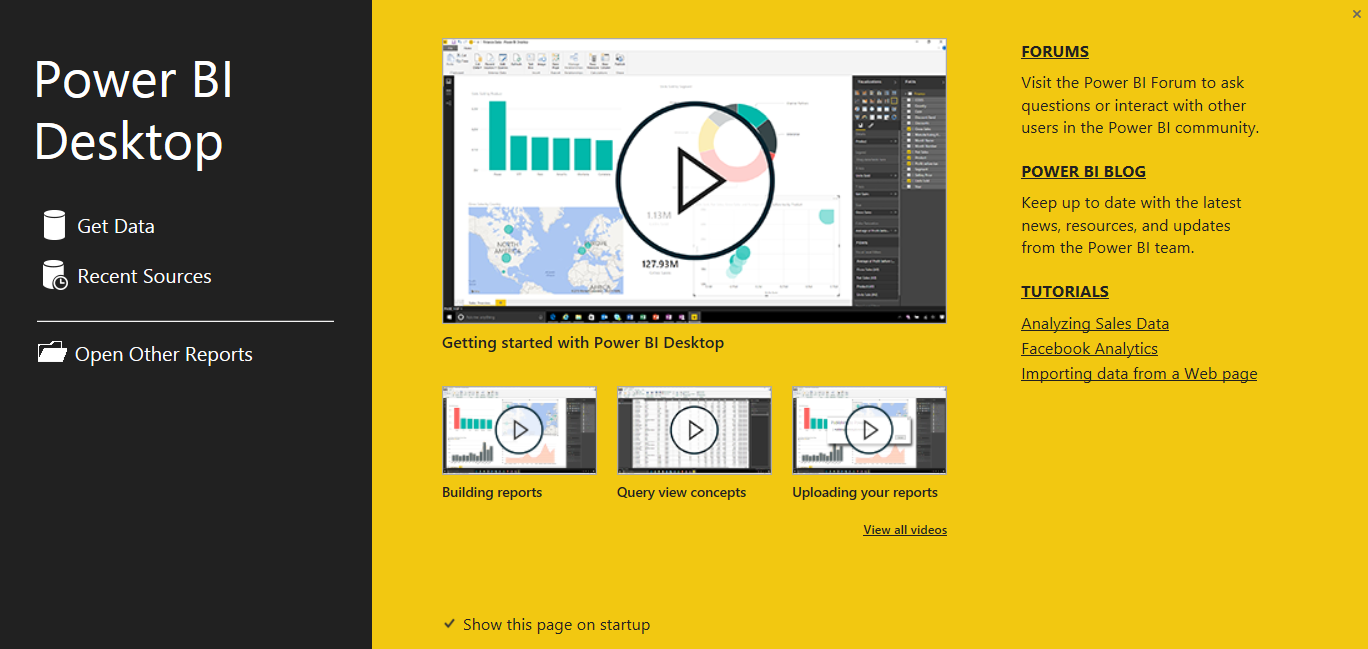
There are a couple of important things to notice on this start page!
- The forums
- As seen in the first part of this series.
This is the perfect place to ask any Power BI related questions.
Microsoft people and of course experts in the community will help you out!
- As seen in the first part of this series.
- Power BI blog
- As seen in the first part of this series.
If you’re interested in keeping up to date with everything the Power BI team is doing, bookmark this link.
- As seen in the first part of this series.
- Tutorials
- The 3 tutorials listed here are perfect for your first encounter if you don’t have your own data source readily available.
They provide you all the required data and they’ll guide you through some of the basic functionality as well!
- The 3 tutorials listed here are perfect for your first encounter if you don’t have your own data source readily available.
Creating our first reports
Those tutorials on the startup screen are an important start to get our first experience with the possibilities of Power BI.
There’s no sense in creating a basic tutorial if Microsoft has already created it for us.
I suggest you follow at least one of these and we’ll see each other at day 3 of this series!
Analyzing sales data from Excel and an OData feedhttps://support.powerbi.com/knowledgebase/articles/471597
Want to check the end result and play around with it instead? |
|
Facebook analytics using Power BI Desktophttps://support.powerbi.com/knowledgebase/articles/461312
Want to check the end result and play around with it instead? |
|
Importing and analyzing data from a Web Page using Power BI Desktophttps://support.powerbi.com/knowledgebase/articles/461315
Want to check the end result and play around with it instead? |
Today we learned
- Installing the Power BI Desktop application
- Getting data from various sources
- Excel
- OData feeds
- social media
- web pages
- Shaping data
- Cleaning and joining data using Power Query
- Visualizing data
- Using bar and line charts
- Treemaps
- And even a map visualization
Got questions, remarks or just want to discuss this blog?
Let me hear about it in the comment section, via Twitter or LinkedIn
Got questions, remarks or just want to discuss this blog?
Let me hear about it in the comment section, via Twitter or LinkedIn
You can share this on Twitter, LinkedIn and Facebook using below buttons.