Let’s be honest, Microsoft isn’t a name that would traditionally be associated with data science.
But just as we’ve witnessed in other areas, they have quickly caught up!
in the last year we’ve seen the following appear on the Microsoft Data Science radar:
- Azure Machine Learning
- Power BI
- Cortana Analytics Suite
- Acquisition of Datazen & Revolution Analytics
- Integration of R in SQL Server
Looking at it like this, it’s just a list like any other. Not even a big list.
The magic happens when we look at what this means for the developers, consultants and ultimately the business.
Azure Machine Learning
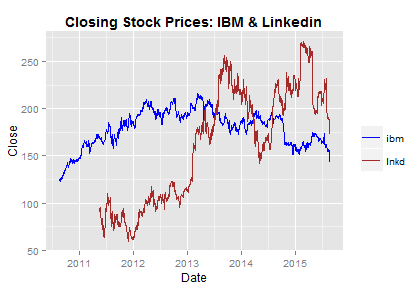
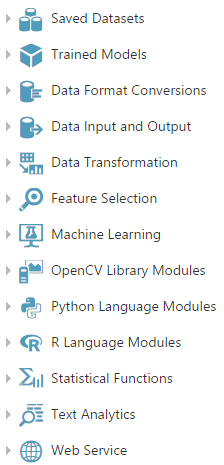
We now have the ability to create AND deploy predictive models in minutes using Azure Machine Learning.
 |
 |
This opens up interesting possibilities where we can send data from SQL Server, a SQL Azure Database or just live from a mobile application or excel to gain insights
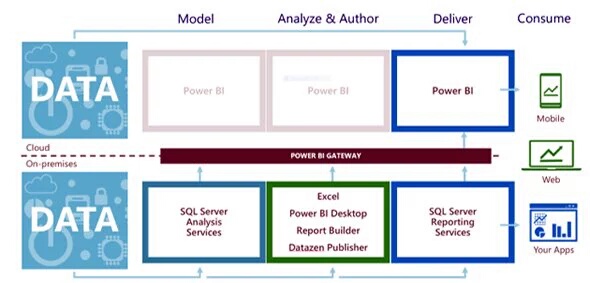
Power BI
If you still need an introduction to Power BI then you’re doing something wrong.
Contact me on twitter, LinkedIn or via the comments.
I’ll gladly talk you through Power BI and why you should be using it for almost everything you do with data in your company.
I mean that, get in touch with me. Now! 🙂
But on a more serious note, I’m going to be crude to Microsoft here.
A long time ago, Power BI started as an over-hyped and underwhelming experience. Everyone saw the potential this Excel stuff had but I’m guessing the experience most people had was similar to mine. That is, Power BI back then was a disappointment because of what we were expecting.
The one good thing it did have at one point was PowerPivot.
Skip forward to august 2015.
The Power BI dream had suddenly come true!
Most of the things we were expecting in the past suddenly were there, in a web service AND a desktop application.
AMAZING!
Skip forward 3 more months and Power BI has exceeded our wildest dreams.
I could literally fill books with all the great stuff the Power BI team has done and enabled for the community.
The Power BI API, a plugin for PowerPoint, custom visualizations, support on all devices, enterprise ready and a lot more all combined with a CRAZY pace of new releases!
If you haven’t used Power BI yet, skip all the praise and commercial talk, go download the desktop application and start working with it. Soon you’ll be an Power BI evangelist as well 😉
![custom-visualizations-same-page-100622406-primary.idge[1]](http://blog.janmulkens.be/wp-content/uploads/2015/11/custom-visualizations-same-page-100622406-primary.idge1_.jpg)
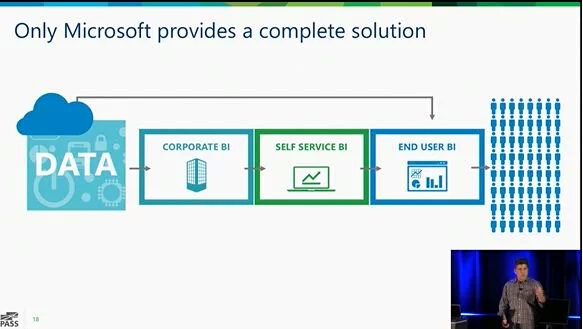
Cortana Analytics Suite
If I had to summarize Cortana Analytics for anyone, I’d say it is basically Azure Machine Learning for predictive analytics combined with Power BI for a beautiful presentation of your data. And sprinkled on top are some of the most incredible and integrated services you can dream of.
Cortana Analytics is not really a product, it’s more a combination of several services that work really great together and form a solution to your questions.
It enables different scenario’s for any case you can think of.
Whether you have a scenario with real-time data analytics, (real-time) predictive analytics or you’re just in need of a data lake to fill with your data for analysis, Cortana Analytics is where you need to be.
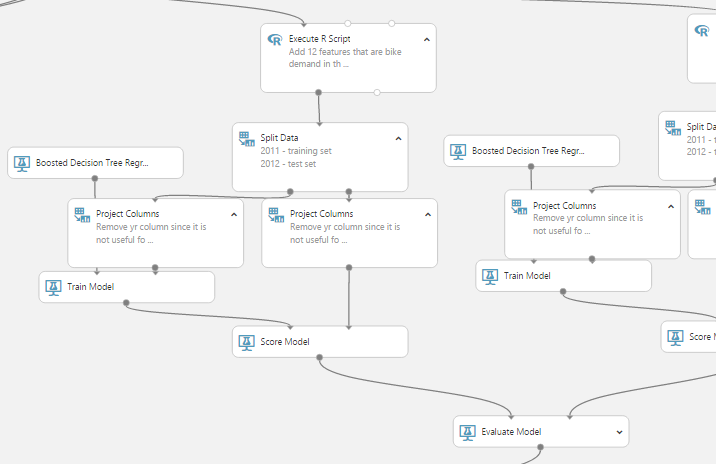
This picture from Microsoft summarizes the Cortana Analytics Suite the best.
It shows you how different tools fit different purposes in the chain from data to insight to action.
![Cortana-Analytics-Suite[1]](http://blog.janmulkens.be/wp-content/uploads/2015/11/Cortana-Analytics-Suite1.png)
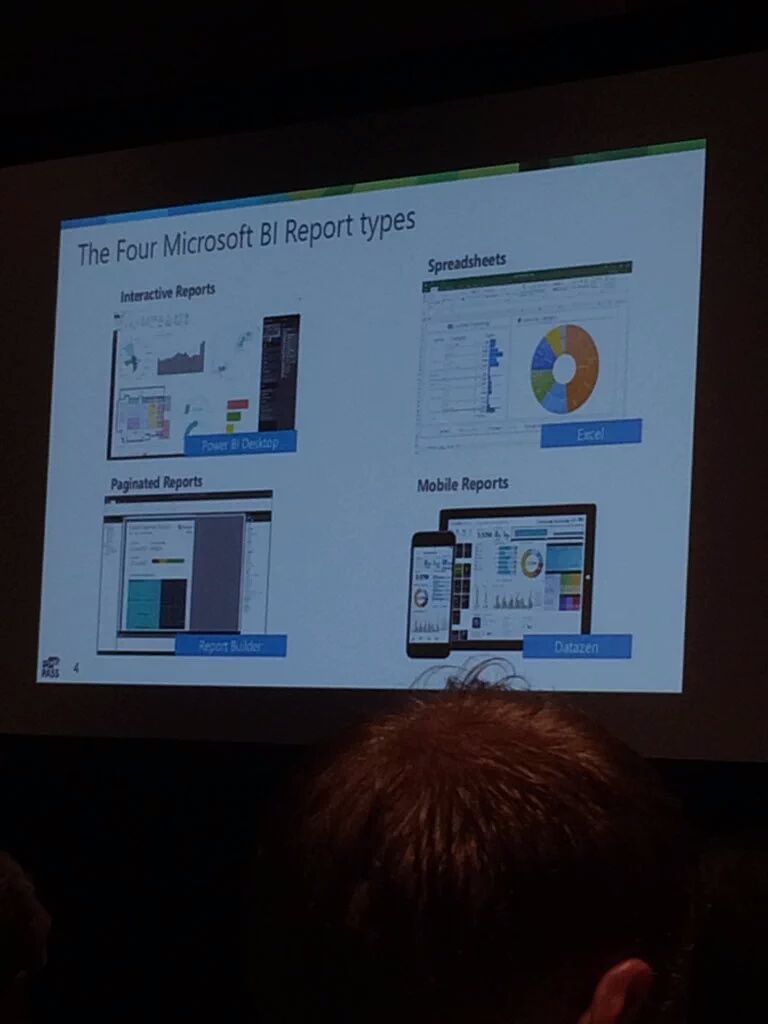
Acquisition of Datazen & Revolutions Analytics
Not much to say except: WOW!
I bet I’m not the only one who did not see both of these coming.
Datazen was already known for it’s mobile dashboarding solutions. It’s acquisition could only mean something big was coming for on-premises BI.
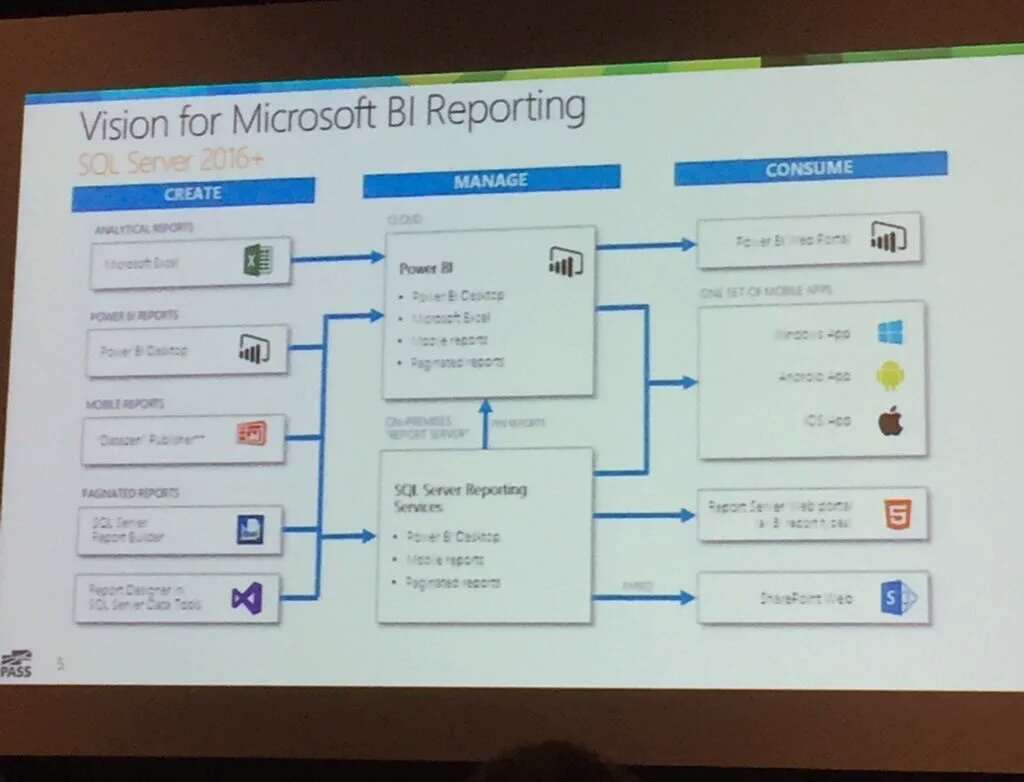
And it did, Microsoft announced at PASS Summit 2015 that Datazen would basically be integrated with SSRS to provide an outstanding mobile BI solution for those who must stay on-premises.
Revolution Analytics was widely known in the world of the R programming language.
Where R standard is limited to a single machine and the memory that machine has, Revolution Analytics provided a scalable solution.
How cool is that? So cool that Microsoft wanted it integrated in SQL Server 2016!
I’m sure that the R services in SQL Server 2016 are just a starting point. But imagine the possibilities from a data science perspective when you combine this with the columnstore and in-memory technologies.
![splash[1]](http://blog.janmulkens.be/wp-content/uploads/2015/11/splash1.jpg) |
![architecture[1]](http://blog.janmulkens.be/wp-content/uploads/2015/11/architecture1.png) |
Integration of R in SQL Server
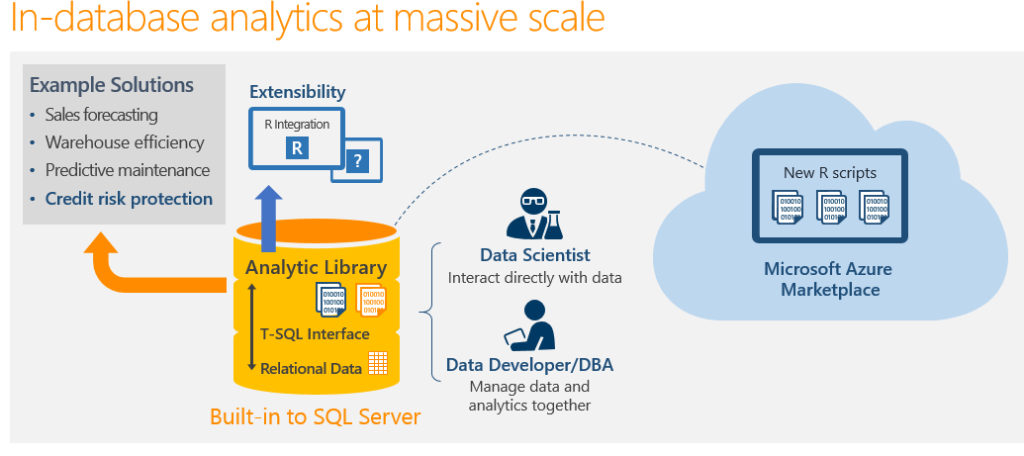
This isn’t just R in SQL Server, it’s an implementation of Revolution R Enterprise in SQL Server!
No longer do you have to pull data to your developer machine, data can just stay in the database where it should be.
Combine this with columnstore indexes and the in-memory technology and you know that the data scientists are now drooling.
Summary
Microsoft has improved so much in the last year, it’s as if it’s a whole new company.
Data professionals are getting a lot of shiny new toys and can expect a lot more solutions to be build end to end on a Microsoft platform.
Whether that platform is on-premises or in the cloud is up to the business to decide.
Data science is no longer unknown territory for people who work with SQL Server, it’s already on our doorstep.
On top of that, Microsoft’s Cortana Analytics solution offers incredible value and an ease of use I’ve never seen before with something like this.
It took me only an hour to set up a solution that parsed real-time sensor data, combined it with reference data in a database and then show it on a Power BI dashboard.
One thing is sure, you can expect some interesting blog posts in the feature.
Not only from myself but the entire SQL Server community!
When you’re ready, move on to this list of training materials I compiled for you. Let’s get started!

![goku-9000[1]](http://blog.janmulkens.be/wp-content/uploads/2015/09/goku-90001-300x169.gif)
![15145-illustration-of-a-stormy-cloud-with-a-warning-symbol-pv[1]](http://blog.janmulkens.be/wp-content/uploads/2015/09/15145-illustration-of-a-stormy-cloud-with-a-warning-symbol-pv1-300x300.png)