Power BI and R – Part 3 (Getting started)

This entry is part [part not set] of 3 in the series Power BI and R

In this post we’ll look at some simple examples of how to use R in Power BI.
While going through these examples, we’ll have a look at what is already possible in this preview version and what is not possible.
We’ll do this by slowly examples from scratch so you can follow or rebuild the examples yourself.
I’ll keep the technical explanations to a minimum as there are already a ton of books and courses filled with that.

So if you’re seeking deep knowledge of the inner workings of R, this post is going to disappoint you.
However, if you’re looking to keep it simple and just get started building cool or useful visualizations in R to explore your data, just keep reading!

In case you missed the previous posts:

In part 1 of this series, I gave you a couple of reasons to start using R for visualizations in Power BI.
In part 2 of this series, I gave you remarks on the R integration. You might’ve caugtht a glimpse of what is possible if you stepped outside of the lines that Microsoft drew. And I showed you an ugly error you can receive because of  decimal symbol setting in your OS.

Read morePower BI and R – Part 3 (Getting started)

Power BI and R – Part 2 (Remarks and errors)

This entry is part [part not set] of 3 in the series Power BI and R

In part 1 of this series, I gave you a couple of reasons to start using R for visualizations in Power BI.

In this part I’ll tell you about the things I discovered and the problems that I ran into in this preview version.

Please note that the remarks below count for the december 2015 version of Power BI Desktop.
R script visuals is still a preview, things might change in later versions.

Read morePower BI and R – Part 2 (Remarks and errors)

Power BI and R – Part 1 (Intro)

This entry is part [part not set] of 3 in the series Power BI and R

First we got Get Data through R Script in beta.
Not much later, we got Custom Visuals through R Script as well.

Everyone was happy…
Twitter went crazy with happiness…
No blogs followed…

“On the fields of Trenzalore, at the integration of R in Power BI, when no living creature can speak ill of R, a Question of how to use it will be asked, a question that must never, ever be answered.”

SilenceWillFall

Read on to learn why R is included in Power BI and if it is something you should even care about. (hint: of course! 😉 )

Read morePower BI and R – Part 1 (Intro)

Global Virtual Power BI User Group

A lot of very cool stuff has been going on lately.
Not only in Microsoft land, but also in my own live and it will affect you as well!
Read on for some great news.

At the end of August, Vishal Pawar (twitter | blog) contacted me via twitter.
He was wondering if I was interested in creating a virtual Power BI community together with him and a couple of other incredible people.
Of course I was interested, but I was already booked completely full for the coming period.
I gave Vishal all my contact info and asked him to please keep me up to date.

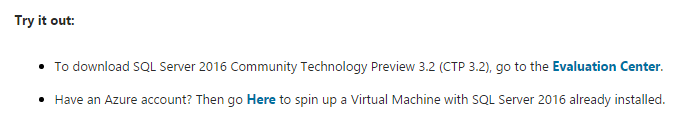
Fast forward to November where Microsoft announced Power BI User Groups to support the Power BI community even more.
This announcement made Vishal pick up the previous idea again mid november.
And so the Global & Virtual Power BI User Group (forum | twitter | facebook) came into existence.

Because of previous engagements I wasn’t able to actively participate yet.
This changed last week when I contacted Vishal and was welcomed with open arms.

Very active community

One of the things that amazed me the most was that there’s already an active community!
It doesn’t matter what platform you like the most, the Global Power BI community is active on most of them.

Power BI Community forum
Facebook
 300+ members as of 2015/12/27
LinkedIn 600+ members as of 2015/12/27

Because Vishal asked me, I’ll also list the people who are leading this community.
Check out all these awesome people, in alphabetical order by first name:

Adam Saxton USA (youtube | twitter)
Ásgeir Gunnarsson Iceland (twitter)
Damodaran Venkatesan USA (twitter)
Dustin Ryan USA (blog | twitter)
Gilbert Quevauvilliers Australia (blog | twitter)
Jan Mulkens Belgium (blog | twitter)
Michael Olafusi Nigeria (blog | twitter)
Patrick Guimonet France (blog | twitter)
Praveen Joshi India
Reza Rad New Zealand (blog | twitter)
Vishal Pawar USA (blog | twitter)

Why a Global & Virtual User Group?

Basically this is a User Group for anyone, anywhere and at any time.
There is no need to hurry to a local meetup after working hours or worry about having to excuse yourself again because of your busy personal life.

Log into the forum at midnight local time and ask a question. Or even answer a question someone else had.
View the latest news on the facebook group or share something cool you saw.
Watch a recording of a previous webinar or volunteer to give a webinar.

Whatever your goal is, you’ll be able to achieve it at your own pace together with some very smart people from all over the world.
Just know that the Global Power BI User Group will be there to support you.
And who knows, you’ll probably even make a ton of new friends!


In person meetups

While the Global Power BI User Group might still meet in real life in the future, if you’d like to find a local Power BI User Group near you today, don’t hesitate do so!

Nothing should stop you from joining a local when you’re already a member of the Global Power BI User Group.
Personally I’m also a member of the Belgian Power BI User Group!


Virtual meetups!

There are already more than 300 members in the Global Power BI User Group.
Adam Saxton AKA “Guy In a Cube” (blog | twitter) gave a first presentation, introducing the Global Power BI User Group, a couple of weeks ago.
And now we’re about to announce our second presentation.

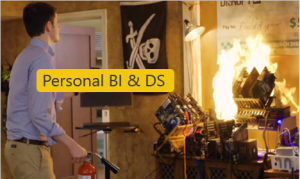
It will be a reworked version of “Personal BI to Personal Data Science“, a session demonstrating how Power BI can easily be used by anyone to not only democratize BI but also data science.
I’ve already given this presentation twice in the past month. First time at the “Data Culture Day London – Power BI Edition” and the second time at the local Belgian SQL Server user group.

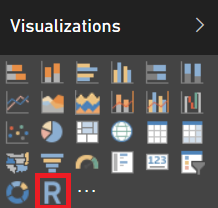
In addition the the previous content, we’ll dip our toes into the a new feature: using R within Power BI!

So far I’ve given this presentation with my colleague Kimberly Hermans (twitter), a data scientist.
With her experience, she rocks the data science parts in the presentation and she can answer your questions surrounding data science. I expect her to show up but she’s not sure about her agenda yet.

In summary:

  • Webinar: Personal BI to Personal Data Science with Power BI
  • When: January 16th, 2016 at 10:30AM EST (GMT -5)
    (Convert to your local time zone)
  • View: Google Hangouts on Air
    • You can’t pre-register anymore but you can follow live on the day!
    • Or you can watch the video afterwards!

Also, don’t forget to join the Global/Virtual Power BI User Group !


Questions or just some feedback you want to give?
Leave a comment, tweet me or go to the Global Power BI User Group forum or facebook page!


Goodbye Datazen, Hello Mobile Reports

24 hours ago I noticed CTP 3.2 being mentioned on MSDN and the download center.
A couple of hours ago it was released, AND HOW!

As we’re used by now, the SQL Server team has made a huge effort.
Get a jump start on all the new features here:

The real treat, and the subject of this blog post, lies in the integration of Datazen into SQL Server Reporting Services.


Mobile Reports released

I’m going to be very brief on this subject because it’s all still very new and I’m sure you want to get started yourself!

The workflow for mobile reports currently boils down to:

  • Authoring of reports in the SQL Server Mobile Report Publisher
  • Publish to on-premises SSRS
  • Consume in Power BI Mobile app

There’s even a new SSRS web portal which you might recognize if you ever used Datazen!

SQL-Server-Reporting-Services-web-portal[1]

For comparison, here’s the Datazen portal.

Datazen

Do you see what Microsoft did?
Perfect integration of Datazen into Reporting Services!
We even notice the differentiation being made between KPI’s, mobile reports and paginated reports.


Start your own Mobile Reporting!

  1. Get SQL Server CTP 3.2 over at the evaluation center.
  2. And get the CTP 3.2 downloads like Report Builder from the download center.
  3. While those are downloading, read up on

There is some sad news however, the Mobile Report Publisher is not available yet.
It is planned for the end of december.

IC840421[1]

Crucial step: Remember to provide Microsoft with a lot of feedback so they can improve the area’s that you think are not up to par yet.


Completion of the Microsoft BI Roadmap

If you’re wondering what the BI roadmap looks like, quickly check this blog post from almost 2 months ago!

After you’ve looked at the road map, you too will notice that this release is a huge leap for SQL Server. The on-premises BI stack now seems to be feature “complete”.
We already had

  • Spreadsheets (excel)
  • Paginated reports (SSRS)
  • Interactive reports (Power BI Desktop)

And we now also received Mobile Reports integrated in SQL Server!

The best thing probably is that your users can enjoy Mobile Reports and Power BI reports in one and the same app. This ensures that they will have the same experience and makes it a bit easier to manage for IT.


What are your thoughts on this course for Mobile Reporting in SQL Server?
Were you expecting something different from the Datazen integration?
Let me know in the comments or via twitter!


Did bits of SQL Server 2016 CTP 3.2 just leak?

Update: CTP 3.2 now really has been released! I highlighted the greatest new feature for you over here


Only 2 weeks after SQL Server CTP 3.1 and there’s already bits of SQL Server 2016 CTP 3.2 to be found on MSDN. For example, MSDN had this update on several SQL Server 2016 pages

MSDN SQL Server 2016 CTP 3.2

The page for the december update (CTP 3.2) is also already eagerly waiting for us

What's new in December Update

Sadly enough, for now, we get greeted by this headline

What's new in December Update 2

At the time of this writing the new image wasn’t available (anymore?) in Azure and there was no CTP 3.2 available for download from the Evaluation Center.

All the fancy downloads like Report Builder for CTP 3.2 etc are already available however!


I’m sure that we’re all dreaming about all the cool new features that Microsoft is going to release! After having seen R integration, will we now see Datazen integration? Will we already see improvements to R Services?

It will probably be another 2 weeks before CTP 3.2 is actually released.
If you’re like me, you’ll be regularly watching MSDN documentation for spoilers on the new features!

Until then, enjoy these SQL Server 2016 resources:


Got thoughts, information or just an opinion to share?
Let me know in the comments or on twitter!

Data science with Microsoft – Personal BI to Personal Data Science

How do you go from Personal BI to Personal Data Science?
Isn’t Data Science only for those rare unicorns that are smarter than most of us combined?
Can we even democratize Data Science within the enterprise?Personal BI & Data Science

Kimberly Hermans (twitter) and I presented on this topic last week, the 27th of November, at the Microsoft UK office. Jen Stirrup (blog | twitter) had organized a great event for the community there: “Data Culture Day London – Power BI Edition“.

This is a write-up of the presentation “Personal BI to Personal Data Science”, hopefully it will make you want to attend the presentation.
Currently you can still attend it at the next SQL Server Usergroup event in Belgium on the 8th of December.
After that date, take a look at my calendar to see if I’m delivering this session somewhere else.

Read on!

Read moreData science with Microsoft – Personal BI to Personal Data Science

%d bloggers like this: