Power BI and R – Part 3 (Getting started)

This entry is part [part not set] of 3 in the series Power BI and R

In this post we’ll look at some simple examples of how to use R in Power BI.
While going through these examples, we’ll have a look at what is already possible in this preview version and what is not possible.
We’ll do this by slowly examples from scratch so you can follow or rebuild the examples yourself.
I’ll keep the technical explanations to a minimum as there are already a ton of books and courses filled with that.

So if you’re seeking deep knowledge of the inner workings of R, this post is going to disappoint you.
However, if you’re looking to keep it simple and just get started building cool or useful visualizations in R to explore your data, just keep reading!

In case you missed the previous posts:

In part 1 of this series, I gave you a couple of reasons to start using R for visualizations in Power BI.
In part 2 of this series, I gave you remarks on the R integration. You might’ve caugtht a glimpse of what is possible if you stepped outside of the lines that Microsoft drew. And I showed you an ugly error you can receive because of  decimal symbol setting in your OS.

Read morePower BI and R – Part 3 (Getting started)

Power BI and R – Part 2 (Remarks and errors)

This entry is part [part not set] of 3 in the series Power BI and R

In part 1 of this series, I gave you a couple of reasons to start using R for visualizations in Power BI.

In this part I’ll tell you about the things I discovered and the problems that I ran into in this preview version.

Please note that the remarks below count for the december 2015 version of Power BI Desktop.
R script visuals is still a preview, things might change in later versions.

Read morePower BI and R – Part 2 (Remarks and errors)

Power BI and R – Part 1 (Intro)

This entry is part [part not set] of 3 in the series Power BI and R

First we got Get Data through R Script in beta.
Not much later, we got Custom Visuals through R Script as well.

Everyone was happy…
Twitter went crazy with happiness…
No blogs followed…

“On the fields of Trenzalore, at the integration of R in Power BI, when no living creature can speak ill of R, a Question of how to use it will be asked, a question that must never, ever be answered.”

SilenceWillFall

Read on to learn why R is included in Power BI and if it is something you should even care about. (hint: of course! 😉 )

Read morePower BI and R – Part 1 (Intro)

Goodbye Datazen, Hello Mobile Reports

24 hours ago I noticed CTP 3.2 being mentioned on MSDN and the download center.
A couple of hours ago it was released, AND HOW!

As we’re used by now, the SQL Server team has made a huge effort.
Get a jump start on all the new features here:

The real treat, and the subject of this blog post, lies in the integration of Datazen into SQL Server Reporting Services.


Mobile Reports released

I’m going to be very brief on this subject because it’s all still very new and I’m sure you want to get started yourself!

The workflow for mobile reports currently boils down to:

  • Authoring of reports in the SQL Server Mobile Report Publisher
  • Publish to on-premises SSRS
  • Consume in Power BI Mobile app

There’s even a new SSRS web portal which you might recognize if you ever used Datazen!

SQL-Server-Reporting-Services-web-portal[1]

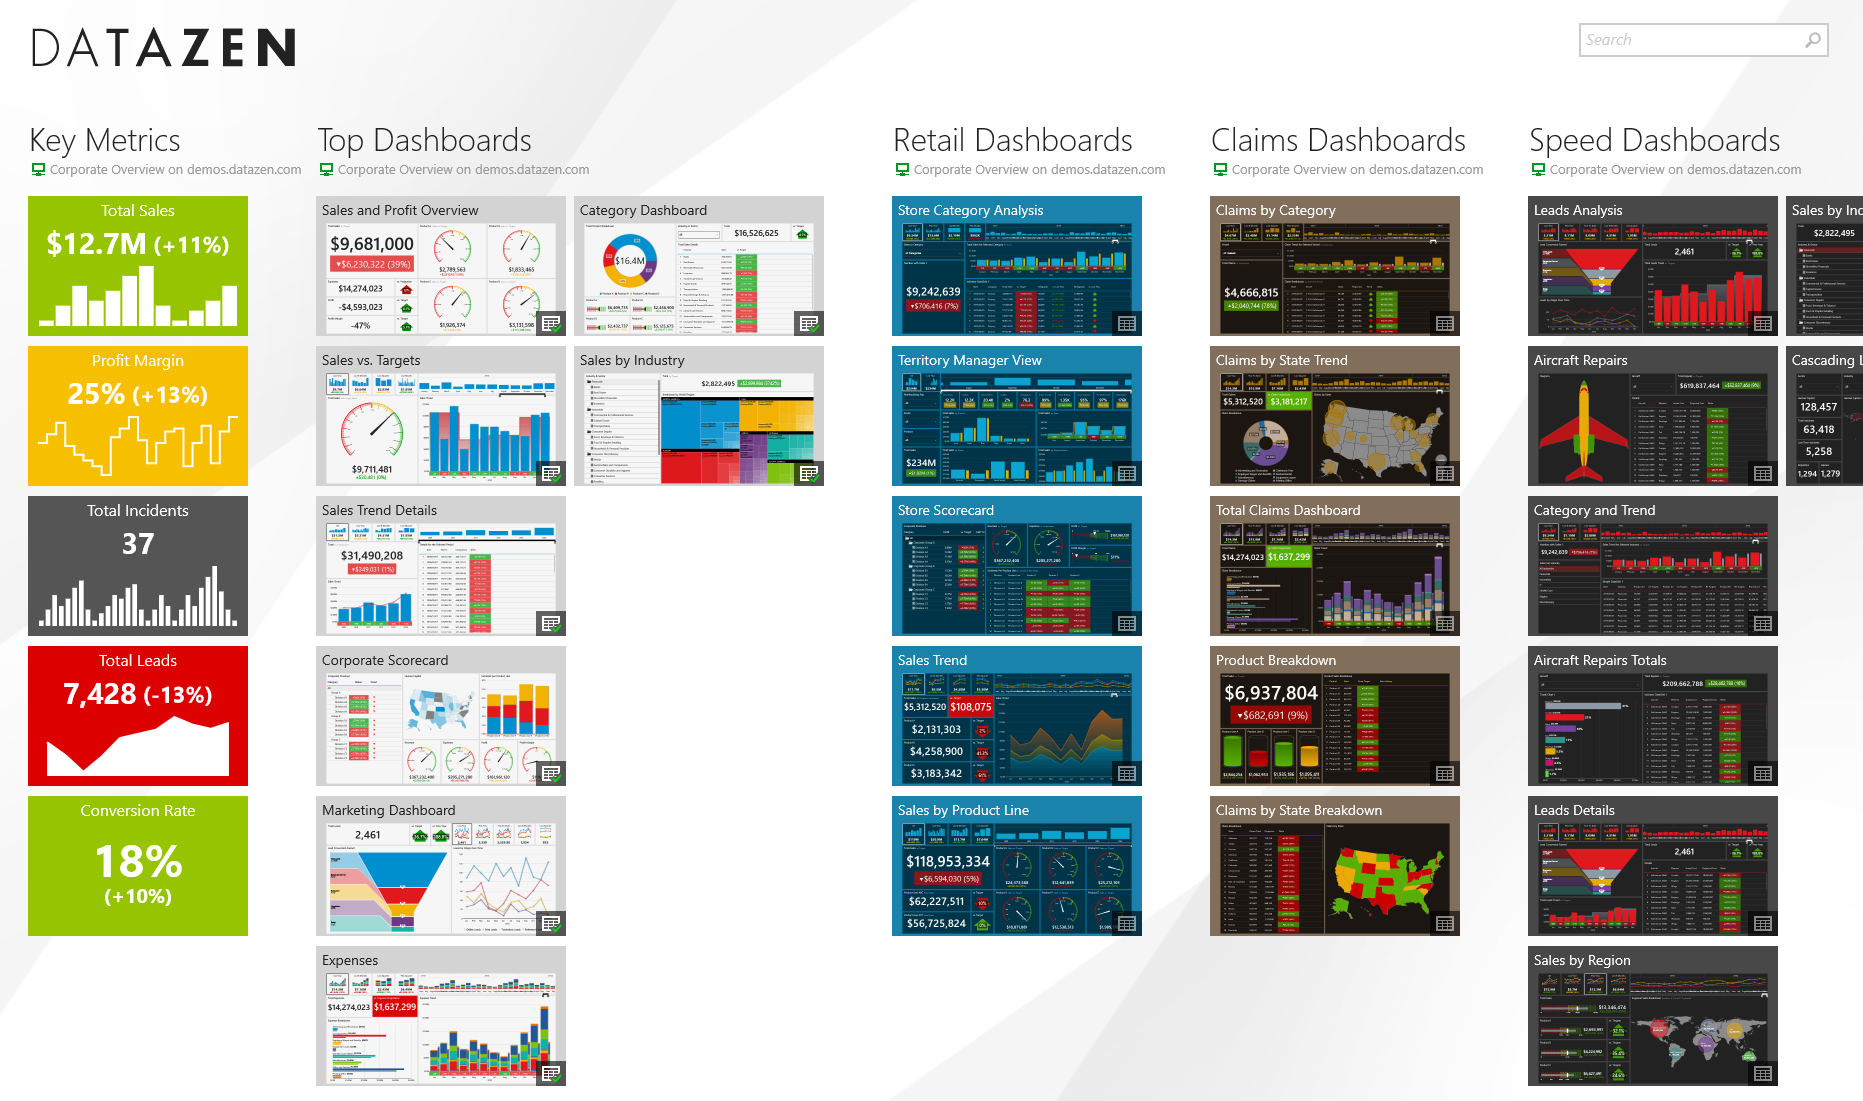
For comparison, here’s the Datazen portal.

Datazen

Do you see what Microsoft did?
Perfect integration of Datazen into Reporting Services!
We even notice the differentiation being made between KPI’s, mobile reports and paginated reports.


Start your own Mobile Reporting!

  1. Get SQL Server CTP 3.2 over at the evaluation center.
  2. And get the CTP 3.2 downloads like Report Builder from the download center.
  3. While those are downloading, read up on

There is some sad news however, the Mobile Report Publisher is not available yet.
It is planned for the end of december.
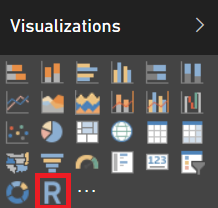
IC840421[1]

Crucial step: Remember to provide Microsoft with a lot of feedback so they can improve the area’s that you think are not up to par yet.


Completion of the Microsoft BI Roadmap

If you’re wondering what the BI roadmap looks like, quickly check this blog post from almost 2 months ago!

After you’ve looked at the road map, you too will notice that this release is a huge leap for SQL Server. The on-premises BI stack now seems to be feature “complete”.
We already had

  • Spreadsheets (excel)
  • Paginated reports (SSRS)
  • Interactive reports (Power BI Desktop)

And we now also received Mobile Reports integrated in SQL Server!

The best thing probably is that your users can enjoy Mobile Reports and Power BI reports in one and the same app. This ensures that they will have the same experience and makes it a bit easier to manage for IT.


What are your thoughts on this course for Mobile Reporting in SQL Server?
Were you expecting something different from the Datazen integration?
Let me know in the comments or via twitter!


Plotting time series in Power BI

Today we’ll match up the data visualization power in Power BI to the ARR in R.
Every time I see one of these post about data visualization in R, I get this itch to test the limits of Power BI.

Tonight I read a post about Plotting time series in R using Yahoo Finance data by Joseph Rickert on the Revolution Analytics blog.
In his blog he describes, in its most simple form, how he gets stock data from the Yahoo Finance API and plots it on a chart.
Sounds like something Power BI can do!

Plotting time series in Power BI - 1

He then goes on to describe making the chart interactive using fancy R magic.

Read morePlotting time series in Power BI

Power BI Custom Visual Contest!

You already know Power BI allows custom data visualizations to be build.
And now Microsoft has created a contest with a $5000 grand prize for those who want to contribute to a better Power BI experience.

Afraid you won’t be the best?
2nd place awards $2500 and 3rd awards $1500 !

You’re not the 3rd best?
there will be THREE (!!!) “People Choice Awards” up for grab as well. Each worth $1000.
These will be judged by the number of twitter mentions for each entry.

Sadly winning one of the first 3 prizes won’t be possible by mentions.
But they will use the following criteria

  • 35.00% – Originality and creativity of the Visual
  • 35.00% – Usefulness and applicability
  • 30.00% – Design and code quality

Interested?
Check out the full post on the official Power BI blog

%d bloggers like this: