SQL Server 2017 Machine Learning Services – Offline Installer Issue

Situation

You’re trying to install SQL Server 2017 Machine Learning Services onto an existing SQL Server 2017 installation.
You select the checkboxes for R en Python because that’s how you roll.
And off you go to the next screens!

Issue

That’s when you remember it… Your server isn’t connected to the internet!
Pretty normal, but in your enthusiasm you completely forgot that SQL Server needs to download some binaries for the R and Python components you so desperately want on your precious machine!

Luckily, the installer comes to your rescue and shows you where to download those binaries it needs.
Turns out however… This link only is for one R component and the installer won’t let you pass to the next screen!

Solution

Microsoft has a complete list of all possible components you could ever want to install while offline. From SQL Server 2016 RTM, over to SQL Server 2017 CTP 1 and up to SQL Server 2017 CU 1.

You can find the full list over at docs.microsoft.com: https://docs.microsoft.com/en-us/sql/advanced-analytics/r/installing-ml-components-without-internet-access

Hopefully, next time you’re installing ML Services, this will save you some time searching for why that “Next” button won’t become active.


SQL Saturday 642 – Sofia

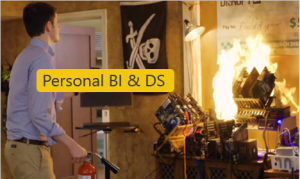
I was lucky enough to get selected as one of the speakers for SQL Saturday 642 in Sofia this year.
Let’s do a quick review of my session and some sessions I visited.

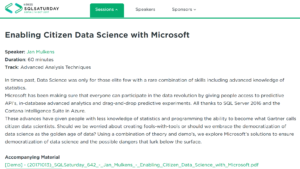
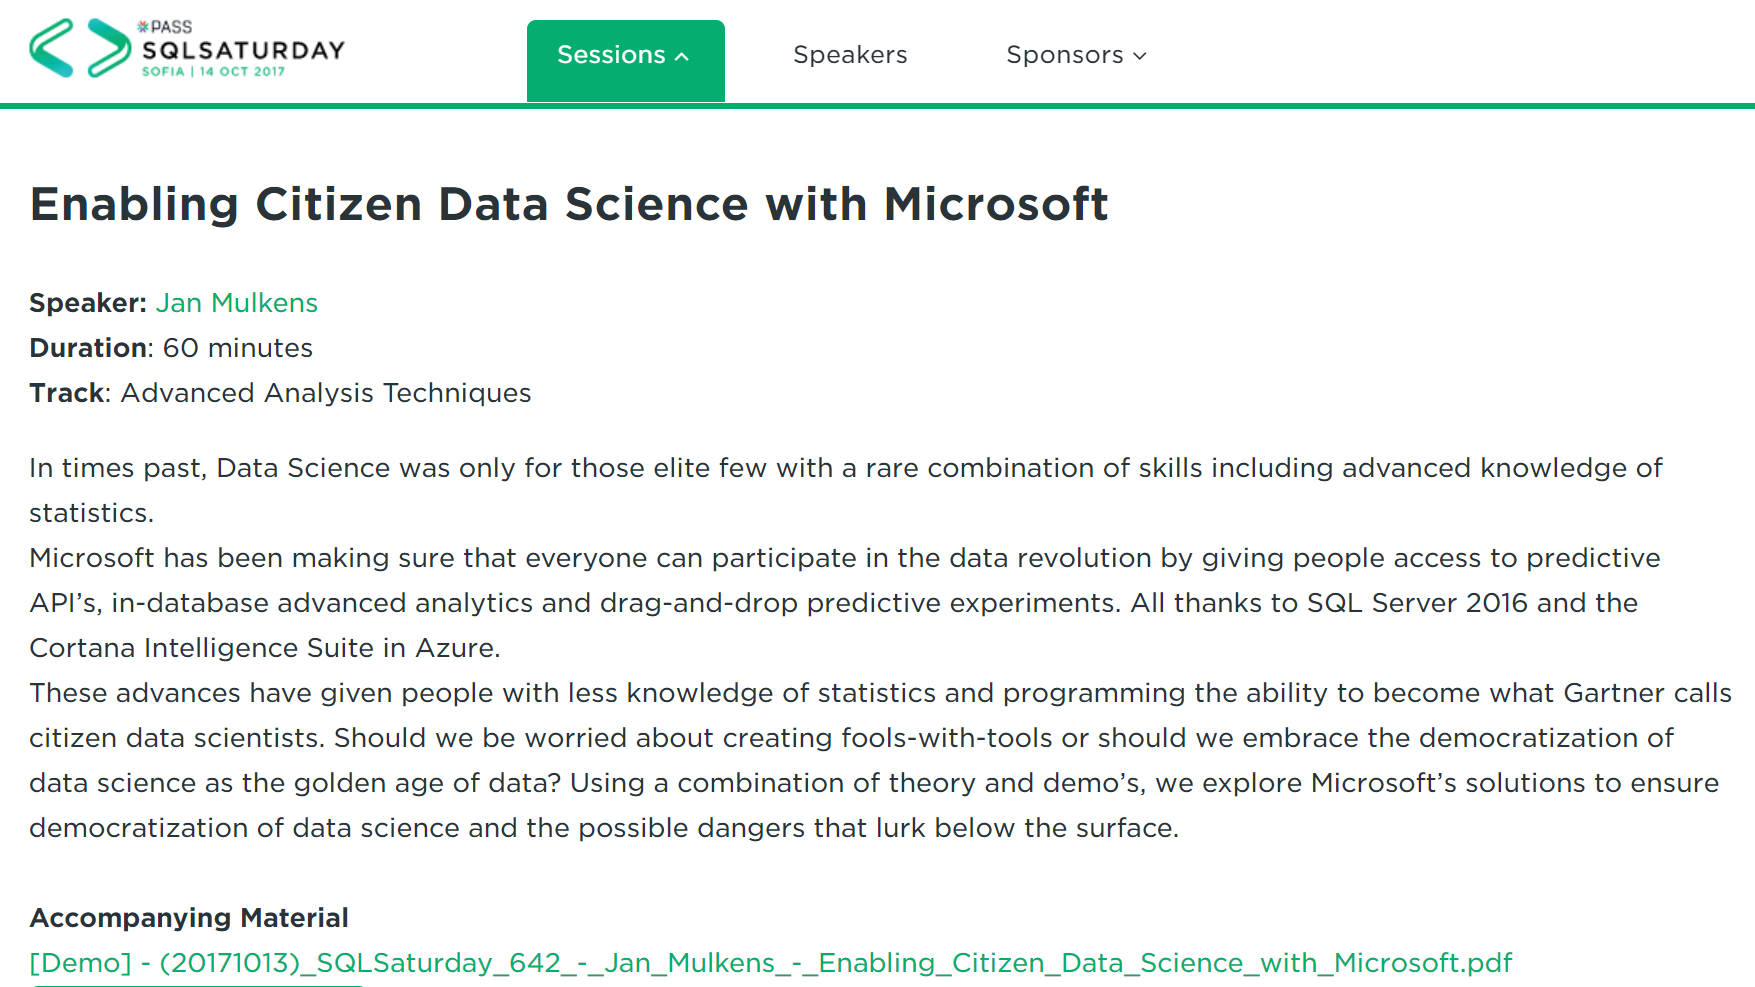
Enabling Citizen Data Science with Microsoft

As a speaker you’re lucky enough to teach people what you know and experienced but also to get feedback from people in your session.
For the people who haven’t seen or heard my session before and who can’t make any sense from the abstract, I’ll slowly be blogging my entire session over the coming weeks. The very short version is: that while data science has become somewhat of a buzz word and a lot of people suddenly want that title. As BI Developers, Analysts, etc. it often is hard to know where to start. I guide you Microsoft’s 3 month long self-paced Data Science course, which covers theory and practice. And I cover the tools you need to get started.

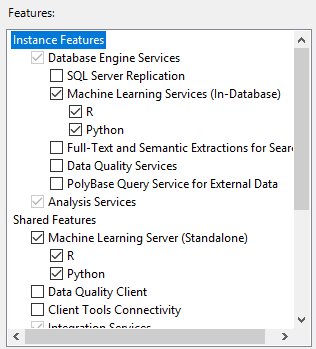
I included the new Azure Machine Learning Services in my slides. Mainly because it’s new and actually very useful.
And one of the things I learned from my audience is that Microsoft’s announcement of these services is actually a bit confusing for people who are getting started. They now get the impression that this is something they NEED. While incredibly useful, when starting out it’s more important to get the basics right instead of trying to perfect the entire lifecycle.


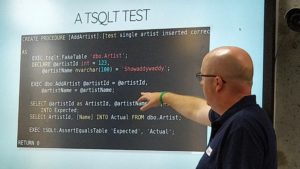
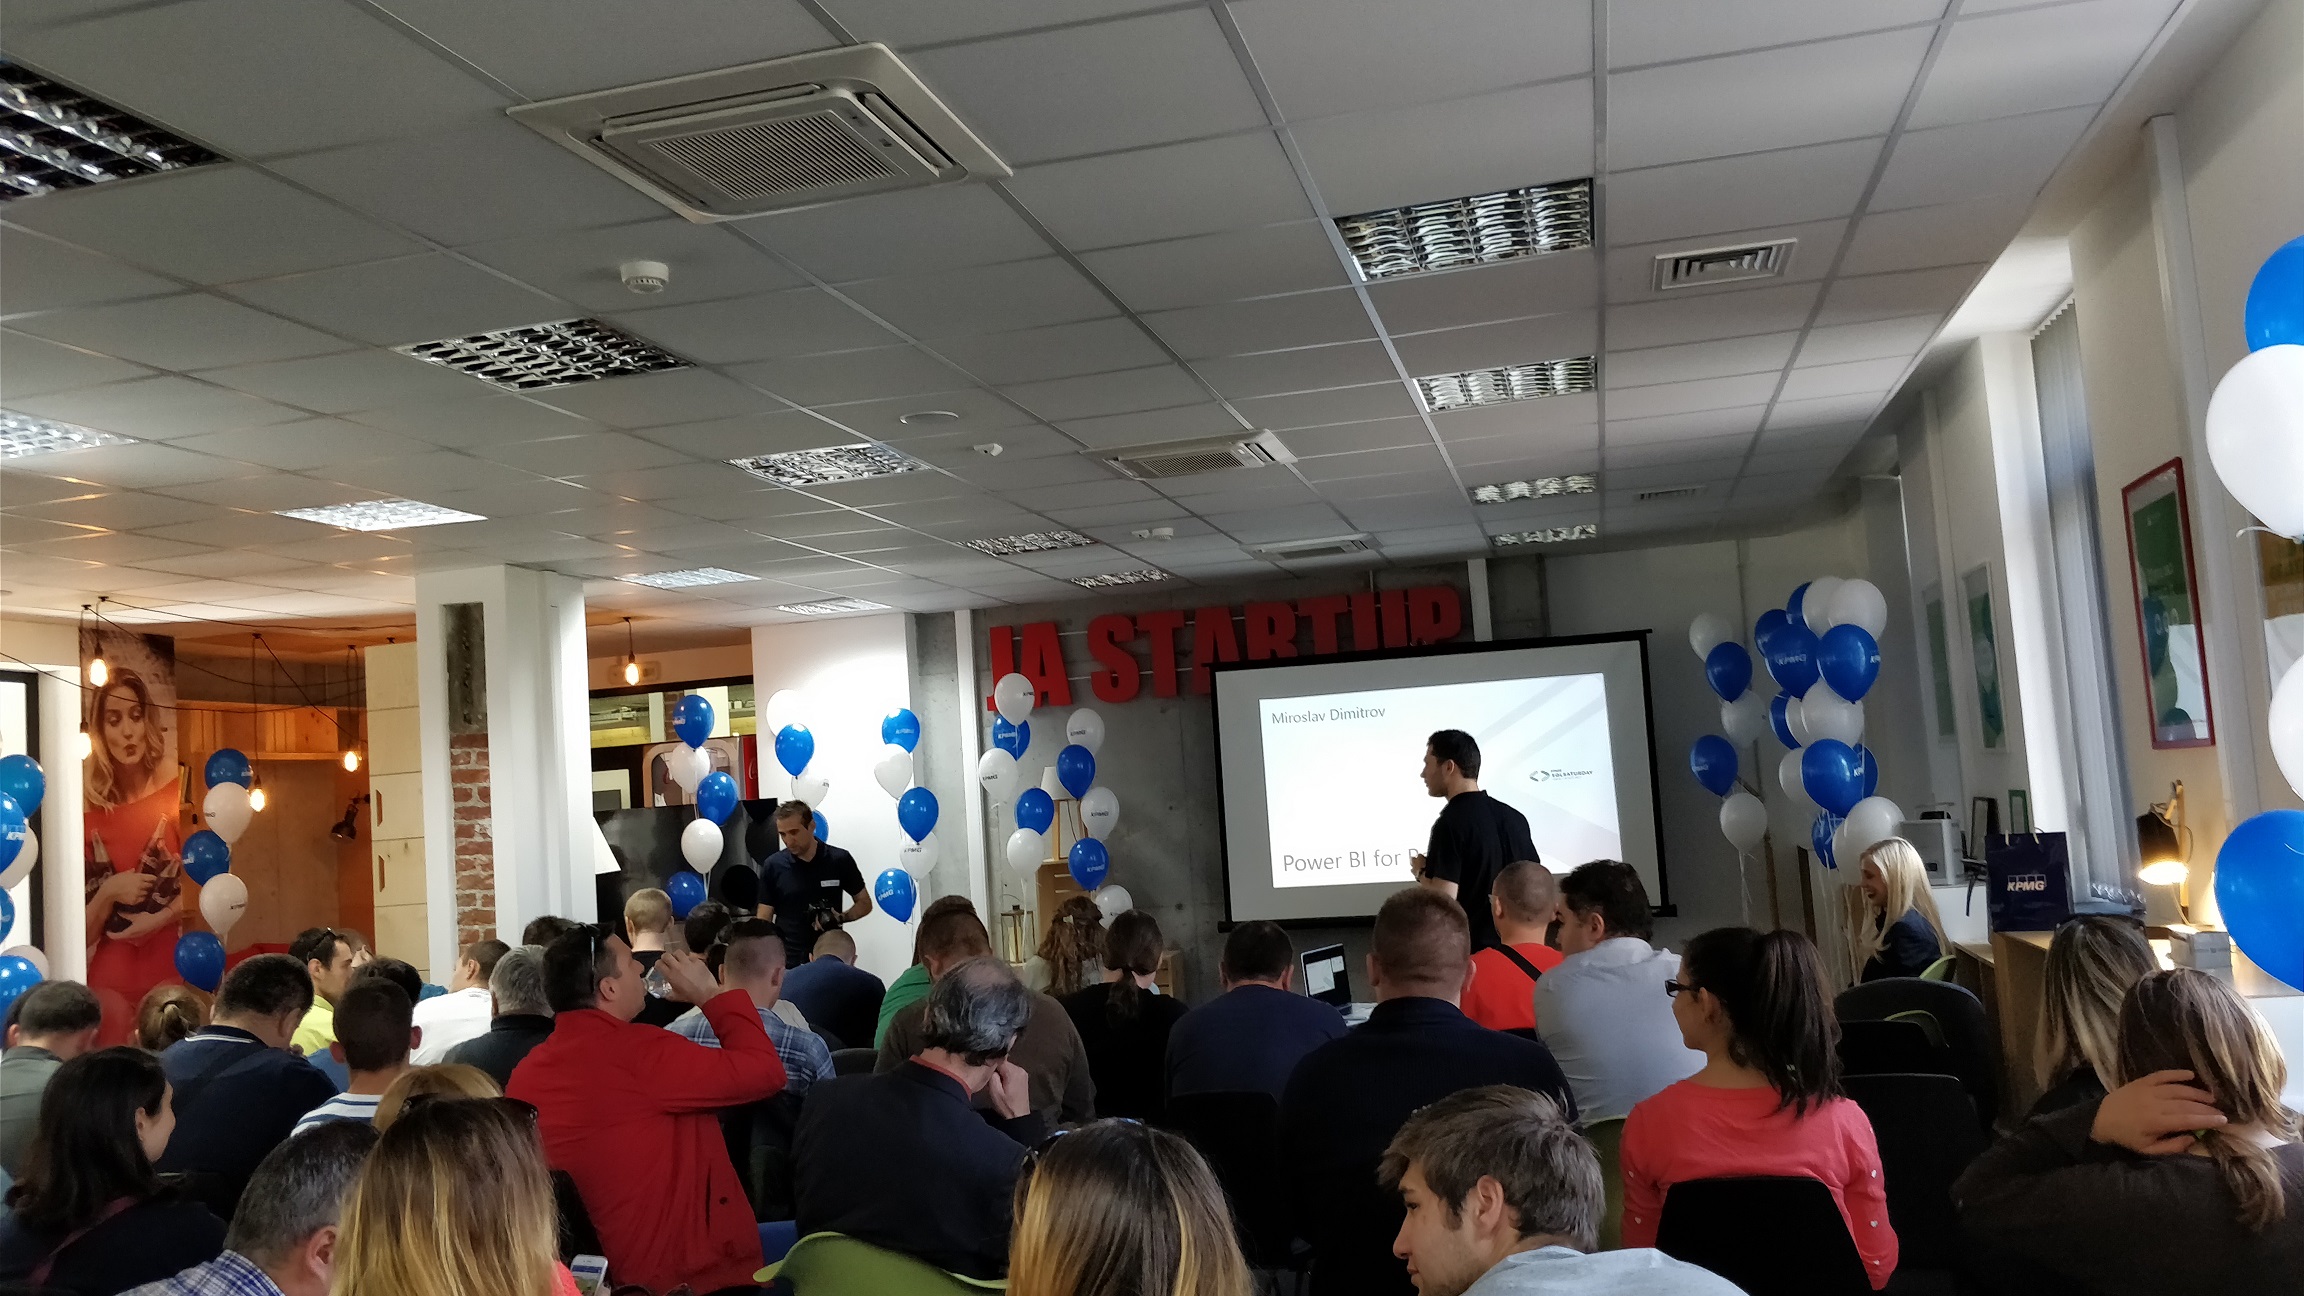
Other very popular sessions were the “Database Continuous Delivery on the Microsoft Platform” by Gavin Campbell (blog | twitter) and “PowerBI for Rookies” by Miroslav Dimitrov.

Gavin Campbell talked about the theory, practice and different parts that make up a Continuous Deployment pipeline. From dacpac’s to version control to testing, building and onto automatically releasing your database.
Basically a must see session for everyone who’s developing databases.

Miroslav Dimitrov guided his huge audience through everything anyone would need to get started with Power BI.
From getting data, to creating a report and publishing a dashboard. Beyond that he talked about some security aspects and cool features like for example QuickInsights and publishing to the web.


Apart from these sessions there of course was a lot of food and enough drinks to be had by all the speakers who gathered on friday and saturday evening.  For me those tend to be the most memorable of an entire event because there’s always people at the table that I look up to.
This time I had the honor of sitting next to Dejan Sarka (blog | twitter) who’s advanced sessions at conferences and even pluralsight courses will teach something to even the smartest people (but also give them a headache because of the difficulty).

Lastly there’s the non-technical things I learn from people and speaking during dinner or the conference itself.


So thank you to the entire SQL Saturday Sofia team for organizing this great event and ensuring everyone had a great time.
For everyone who hasn’t attended one of these yet, start doing it! SQL Saturday’s, other conferences and user group meetings both virtual and real life are a good way to learn more and to get to know new people.


I’m attending and presenting at… ALL THE EVENTS!

This year I’ve already presented at more events than I dreamt off at the start of the year (5).
And the invites keep coming in! (5 more!)
This is going to be a long read, a punishment from me to me because I slacked off in blogging in the past months.

So apart from being bored, there’s 2 reasons why you would want to read this post.
1) Interest in, but some fear of, attending and presenting at conferences, user group and community events in general.
2) You’re me from the future and you’re wondering about that amazement and the exciting feeling the young Jan had about these first events. You’re wondering about what fears you overcame and you want to look back at how it all started.

Expect to find the following:

  • UK Power BI Summit (2017/02/17)
  • Denver SQL Server User Group (2017/03/17)
  • Battle of the Beards (2017/03/29)
  • SQL Saturday Israel (2017/04/26)
  • Belgian Information Worked User Group (2017/05/09)
  • in short: 5 more events to find me at before the end of june!

So whichever reason you have, come on in and start reading!

Read moreI’m attending and presenting at… ALL THE EVENTS!

Presenting a webinar, not the same as a conference

Last saturday Back in January, I presented my first webinar for the Global Power BI usergroup.
It was a redelivery of the Personal BI to Personal Data Science session I’ve already given twice together with my colleague Kimberly Hermans (twitter).
Although there was no real negative feedback and even some positive feedback in private, I don’t think I did great.

I approached the webinar the same way as I do a regular presentation.
And boy oh boy, was I wrong to do it this way…

There’s all kinds of different and extra things to take into account compared to an in-person conference or usergroup presentation.

  • The software you’re using
    We used Google+ Hangouts and while I tried it out before the webinar, I didn’t prepare how I would be taking questions. That could’ve gone a lot better.
  • The microphone you use
    The microphone I used was the one that came with my phone. The quality wasn’t the best, especially combined with the room I was in.
  • The room you’re in
    Using a cheap microphone tends to be OK. But in the wrong room you’ll get a lot of echo or environment noise.
  • No or very limited interaction with your audience
    This one struck me the worst. I couldn’t interact with or read the audience which made me unusually nervous.

On top of that, because of conflicting schedules I had to present alone this time.
I thought I would be OK as I knew most of the data science stuff on a basic level.
But it also means that all the interaction and the dynamic that previously existed in the presentation was gone. No jokes, no natural tempo changes, no interaction between presenters.
In my opinion this was the main killer of the webinar.

What’s next?

UserGroup

The Virtual Global Power BI User Group is still organising monthly webinars. You can join or present yourself as well.
Or just participate in the usergroup via different channels like TwitterFacebook, LinkedIn and our YouTube channel.

Personal

I’m embarking on a new webinar journey as well.
More news will follow soon.


Power BI and R – Part 3 (Getting started)

This entry is part [part not set] of 3 in the series Power BI and R

In this post we’ll look at some simple examples of how to use R in Power BI.
While going through these examples, we’ll have a look at what is already possible in this preview version and what is not possible.
We’ll do this by slowly examples from scratch so you can follow or rebuild the examples yourself.
I’ll keep the technical explanations to a minimum as there are already a ton of books and courses filled with that.

So if you’re seeking deep knowledge of the inner workings of R, this post is going to disappoint you.
However, if you’re looking to keep it simple and just get started building cool or useful visualizations in R to explore your data, just keep reading!

In case you missed the previous posts:

In part 1 of this series, I gave you a couple of reasons to start using R for visualizations in Power BI.
In part 2 of this series, I gave you remarks on the R integration. You might’ve caugtht a glimpse of what is possible if you stepped outside of the lines that Microsoft drew. And I showed you an ugly error you can receive because of  decimal symbol setting in your OS.

Read morePower BI and R – Part 3 (Getting started)

Power BI and R – Part 2 (Remarks and errors)

This entry is part [part not set] of 3 in the series Power BI and R

In part 1 of this series, I gave you a couple of reasons to start using R for visualizations in Power BI.

In this part I’ll tell you about the things I discovered and the problems that I ran into in this preview version.

Please note that the remarks below count for the december 2015 version of Power BI Desktop.
R script visuals is still a preview, things might change in later versions.

Read morePower BI and R – Part 2 (Remarks and errors)

Power BI and R – Part 1 (Intro)

This entry is part [part not set] of 3 in the series Power BI and R

First we got Get Data through R Script in beta.
Not much later, we got Custom Visuals through R Script as well.

Everyone was happy…
Twitter went crazy with happiness…
No blogs followed…

“On the fields of Trenzalore, at the integration of R in Power BI, when no living creature can speak ill of R, a Question of how to use it will be asked, a question that must never, ever be answered.”

SilenceWillFall

Read on to learn why R is included in Power BI and if it is something you should even care about. (hint: of course! 😉 )

Read morePower BI and R – Part 1 (Intro)

Goodbye Datazen, Hello Mobile Reports

24 hours ago I noticed CTP 3.2 being mentioned on MSDN and the download center.
A couple of hours ago it was released, AND HOW!

As we’re used by now, the SQL Server team has made a huge effort.
Get a jump start on all the new features here:

The real treat, and the subject of this blog post, lies in the integration of Datazen into SQL Server Reporting Services.


Mobile Reports released

I’m going to be very brief on this subject because it’s all still very new and I’m sure you want to get started yourself!

The workflow for mobile reports currently boils down to:

  • Authoring of reports in the SQL Server Mobile Report Publisher
  • Publish to on-premises SSRS
  • Consume in Power BI Mobile app

There’s even a new SSRS web portal which you might recognize if you ever used Datazen!

SQL-Server-Reporting-Services-web-portal[1]

For comparison, here’s the Datazen portal.

Datazen

Do you see what Microsoft did?
Perfect integration of Datazen into Reporting Services!
We even notice the differentiation being made between KPI’s, mobile reports and paginated reports.


Start your own Mobile Reporting!

  1. Get SQL Server CTP 3.2 over at the evaluation center.
  2. And get the CTP 3.2 downloads like Report Builder from the download center.
  3. While those are downloading, read up on

There is some sad news however, the Mobile Report Publisher is not available yet.
It is planned for the end of december.

IC840421[1]

Crucial step: Remember to provide Microsoft with a lot of feedback so they can improve the area’s that you think are not up to par yet.


Completion of the Microsoft BI Roadmap

If you’re wondering what the BI roadmap looks like, quickly check this blog post from almost 2 months ago!

After you’ve looked at the road map, you too will notice that this release is a huge leap for SQL Server. The on-premises BI stack now seems to be feature “complete”.
We already had

  • Spreadsheets (excel)
  • Paginated reports (SSRS)
  • Interactive reports (Power BI Desktop)

And we now also received Mobile Reports integrated in SQL Server!

The best thing probably is that your users can enjoy Mobile Reports and Power BI reports in one and the same app. This ensures that they will have the same experience and makes it a bit easier to manage for IT.


What are your thoughts on this course for Mobile Reporting in SQL Server?
Were you expecting something different from the Datazen integration?
Let me know in the comments or via twitter!


Data science with Microsoft – Personal BI to Personal Data Science

How do you go from Personal BI to Personal Data Science?
Isn’t Data Science only for those rare unicorns that are smarter than most of us combined?
Can we even democratize Data Science within the enterprise?Personal BI & Data Science

Kimberly Hermans (twitter) and I presented on this topic last week, the 27th of November, at the Microsoft UK office. Jen Stirrup (blog | twitter) had organized a great event for the community there: “Data Culture Day London – Power BI Edition“.

This is a write-up of the presentation “Personal BI to Personal Data Science”, hopefully it will make you want to attend the presentation.
Currently you can still attend it at the next SQL Server Usergroup event in Belgium on the 8th of December.
After that date, take a look at my calendar to see if I’m delivering this session somewhere else.

Read on!

Read moreData science with Microsoft – Personal BI to Personal Data Science

Data science with Microsoft – Training materials

Today I’ll be guiding you through the, sometimes very busy, world of Microsoft training material.
We’ll put the focus on the training material for data science.

Expect everything you need to become fluent with Microsoft’s Data science solutions.

  • Free training courses with certificates
  • Free webinars & recordings of live sessions
  • Free (e-)books
  • Documentation & Learning Paths
  • Microsoft Virtual Academy

Read on for the good stuff!

Read moreData science with Microsoft – Training materials

%d bloggers like this: